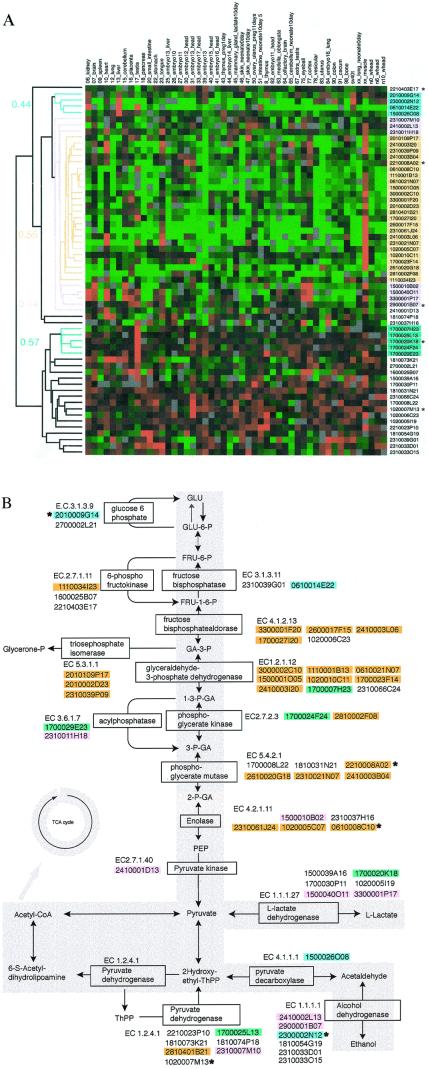
Figure 5.
(a) Hierarchical tree view of the clustered genes that are involved in the glycolysis pathway. The colors correspond to those of b. Gene names are provided in Fig. 9, which is published as supplementary data on the PNAS web site, www.pnas.org. (b) Glycolysis pathway map derived from the RIKEN 19K set. Genes that have high correlation with each other are colored. Genes colored in yellow, blue, and green show the correlation coefficient value of 0.64, 0.52 and 0.54, respectively. The genes shown in pink were categorized in the same group as the genes shown in yellow but with a correlation coefficient value of 0.42. A * indicates the annotations of these genes were inherited from the FANTOM annotation.

