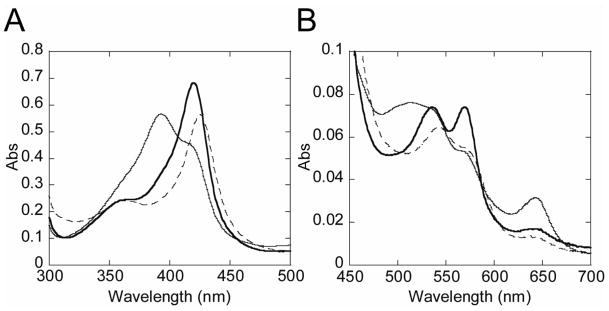
Fig. 2. UV-visible absorption spectra of M. tuberculosis CYP125A1C429L.
The Soret (A) and enlarged visible (B) regions are shown. Spectra of the resting ferric (thin line), ferric LP10 (thick line), and ferric imidazole (dashed line) forms were recorded at the total hemoprotein concentration of 6.45 μM in 50 mM potassium phosphate buffer (pH 7.4) containing 0.1 mM EDTA at 23 °C.

