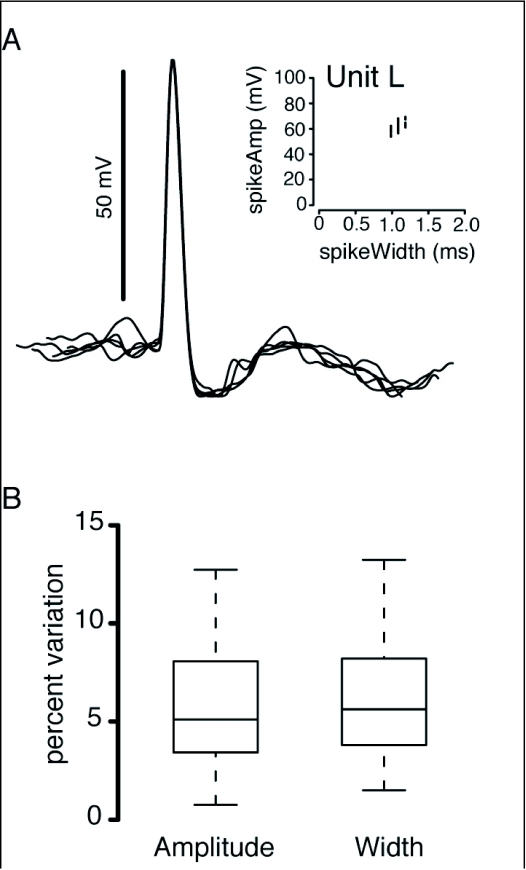
Figure 2.
Only single unit recordings were analyzed in this manuscript. Recordings were defined as single unit if they displayed less than 15% variation in spike amplitude and width. (a) Overlaid traces of 5 spikes from unit L, which showed 3.34% variation in spike height and 4.14% variation in spike width, (b) A box plot showing the mean, standard error, and range of variation in spike amplitude and width of all included units.

