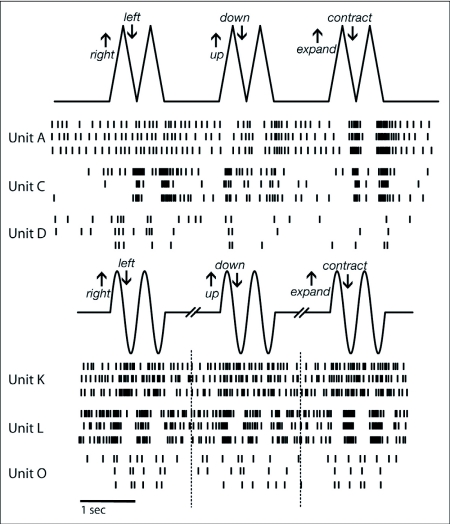
Figure 5.
A raster plot of the response of six different Manduca sexta units to the direction test. The top trace shows object position during the direction test as coded in the Matlab Psychophysics Toolbox experiments. Raster trains of response for three different units (three trials for each) are shown beneath the position trace. The second solid trace shows object position as coded in the Vision Egg experiments. Again, raster trains of response for three different units (three trials for each) are shown beneath the position trace. For both types of direction test (saw-tooth and sine-wave position profiles), OSDNs showed relatively consistent spike timing across trials.

