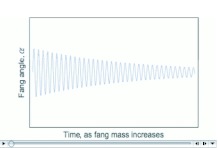
Video 5.
A graphical representation of output from the hydrodynamic forcing model (Figure 9 and Eq. 1). As the animation proceeds, the mass of the fang increases, decreasing oscillation frequency and increasing oscillation amplitude. URL:http://www.insectscience.org/9.62/ref/i1536-2442-9-58-v05.avi

