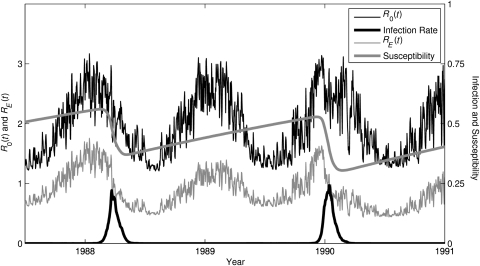
Figure 2.
Time series of simulated epidemic influenza in New York State from an absolute humidity-forced, susceptible-infected-recovered susceptible (SIRS) model. Simulation is shown from July 1987 through December 1990 for the best-fitting parameter combination (Table 1). The SIRS model simulates 2 influenza subtypes (A/H3N2 and A/H1N1), but only the time series for A/H3N2 is shown. Plotted lines indicate the steady rise of susceptibility (S(t)/N) to A/H3N2 in the time between outbreaks (thick gray line); the seasonal cycle of the basic reproductive number, R0(t) (thin black line), due to seasonal changes in absolute humidity plus shorter time-scale variability due to changes in absolute humidity due to weather variability; the time series of the effective reproductive number, RE(t) (thin gray line); and the time series of infection rate (proportion infected × 10, thick black line). During outbreaks, both S(t) and RE(t) drop precipitously as susceptibles are infected and S(t) decreases. Once RE(t) drops below 1, the outbreak begins to abate. Of note, A/H3N2 was not present in the simulation from April 1988 to March 1989; hence, no outbreak was possible during this winter (A/H1N1 was present and is not shown).

