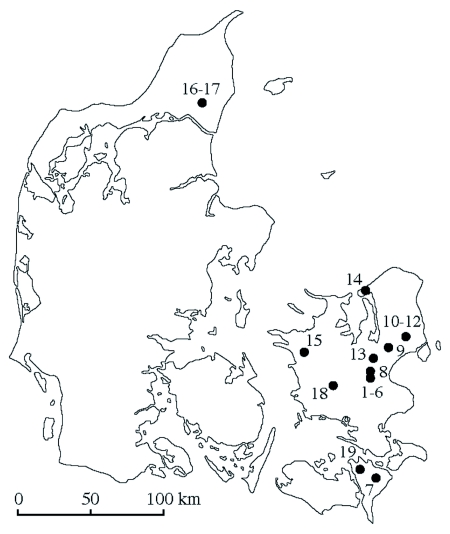
Figure 1.
Locations in Denmark where samples were collected. The numbers refer to the sampling locations. In some cases, a number of samples were collected close together at one location; these are then indicated by one dot on the map. 1–6: Kværkeby; 7: Maglebrænde; 8: Vigersted; 9: Taastrup; 10–12: Ejby; 13: Viby; 14: Lynæs; 15: Svebølle; 16–17: Try Enge; 18: Suserup; 19: No. Vedby. Locations 13, 16–17, and 19 were not used for the analysis.

