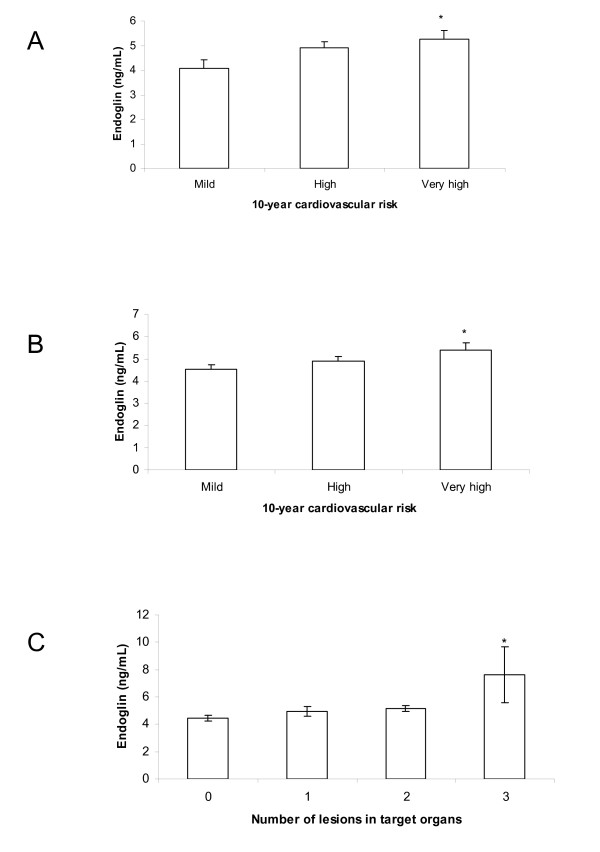
Figure 3.
Comparison of Sol-endoglin plasma levels, 10-year cardiovascular risk and number of damaged target organs. (A) 10-year cardiovascular risk in patients with hypertension and diabetes. (B) All patients with diabetes. (C) Number of damaged target organs in patients with patients hypertension and diabetes. Data (ng/mL) are expressed as means ± SEM. One-way ANOVA: *P < 0.05 vs. mild group (A and B) and vs. 0 group (C).

