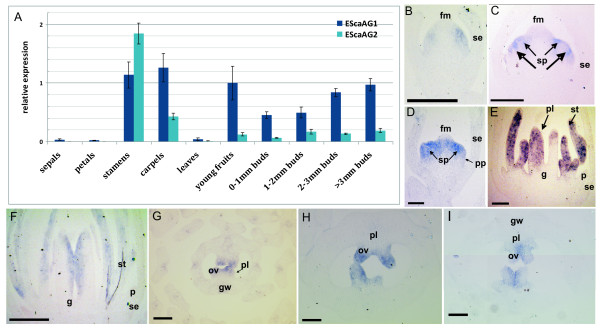
Figure 2.
Expression analysis of EScaAG1 and EScaAG2 in flowers of untreated plants shown by quantitative RT-PCR and in situ hybridization. (A) Q-PCR based relative expression analysis of EScaAG1 and EScaAG2 in E. californica. Actin and GAPDH were used as reference genes. (B) to (I) in situ hybridization pattern of the EScaAG genes using an EScaAG1 probe. (B) Longitudinal section of a bud in stage 2. (C) Longitudinal sections of a bud in stage 3. (D) Longitudinal sections of a bud in stage 4. (E) Longitudinal section of a bud in late stage 6. (F) Longitudinal section of a bud in stage 7. (G) Transverse section of a bud in stage 7. (H) Transverse section of a bud in stage 8. (I) Transverse section of a bud in stage 9. All scale bars = 100 μm, abbreviations: fm, floral meristem; g, gynoecium; gw, gynoecium wall; ov, ovule; p, petal; pl, placenta; pp, petal primordium; se, sepal; sp, stamen primordium; st, stamen.

