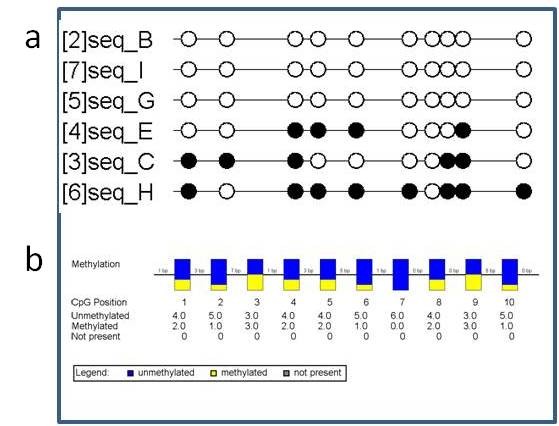
Figure 4.

BIQAnalyzer study data. (a) The reduced BIQAnalyzer tutorial dataset was processed within BIQAnalyzer with default settings and a lollipop display was produced. Filled (methylated) and empty (non methylated) circles mark relative genomic positions of CpG sites under study. Each row shows one clone that was analyzed, providing the clone name beside (left). The line break was produced automatically by the tool. (b) The reduced BIQAnalyzer tutorial dataset was processed within BIQAnalyzer with default settings and a summary display was produced. The boxes display a summary of relative amount of clones being methylated (yellow) or non methylated (blue) at a specific CpG site. Between neighbouring CpG sites genomic distances (not correlation) are displayed. The rows below the boxes show the genomic basepair position, the absolute amount of methylated, non methylated and not present clones for each site.
