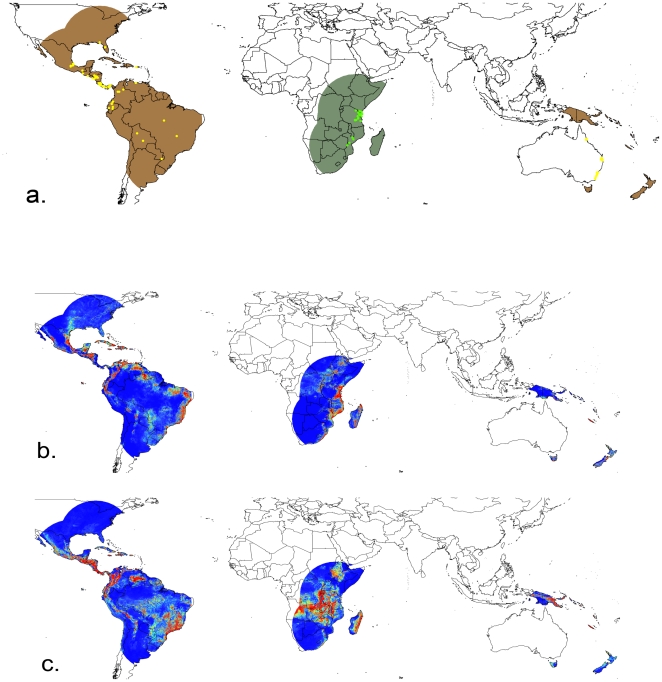
Figure 3. Study area and Maxent model predictions.
Panel 3a shows the study region for native (green) and introduced (brown) study areas. Occurrence points are shown for native (bright green) and introduced (yellow) localities. Panels 3b and 3c show Maxent models built for native and introduced specimens, respectively. Warmer colors indicate habitat that is more suitable according to the model.

