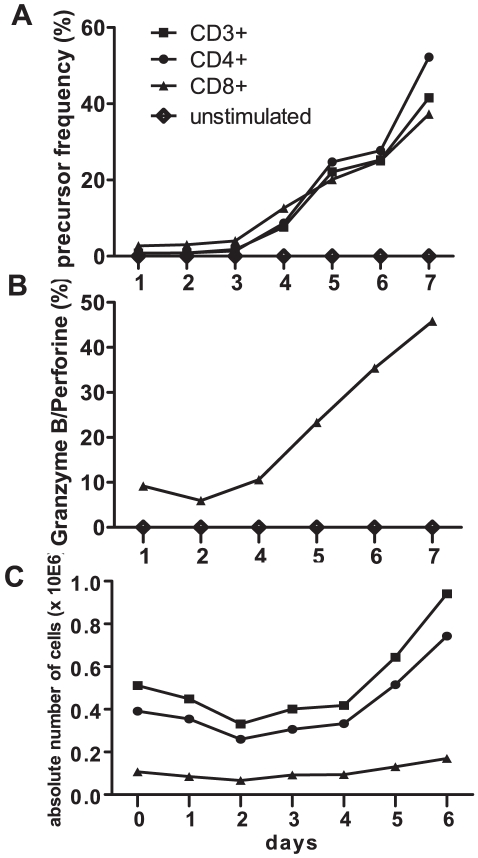
Figure 3. Kinetics of allogeneic T-cell responses to CD40-B cell stimulation.
CFSE-labeled PBMC from a healthy individual were cultured for 7 days with allogeneic splenocyte-derived CD40-B cells. A. CFSE-dilution patterns of CD3+, CD4+, CD8+ T cells were analyzed daily, and PF were calculated with ModFit® software. B. Intracellular granzyme B and perforin expression were analyzed daily in CD8+ T cells. Depicted are the percentages of CD8+CFSElow T cells that expressed granzyme B and/or perforin. C. Absolute numbers CD3+, CD4+ and CD8+ T cells during co-culture of CFSE-labelled PBMC with allogeneic CD40-B cells. Vital PBMC were counted daily using trypan blue, and proportions of CD3+, CD4+ and CD8+ T cells were analyzed by flowcytometry. Absolute numbers of T-cell subsets were calculated by multiplying the number of vital PBMC with the proportions of T cells obtained from flowcytometric analysis.

