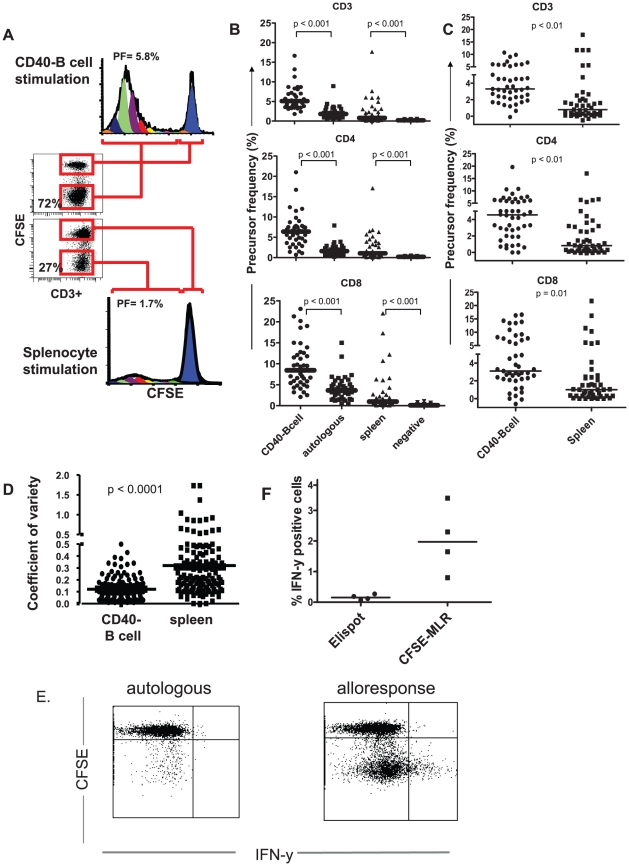
Figure 4. Comparison of CD40-B cell and splenocyte stimulation and comparison of CFSE-MLR with IFN-γ ELISPOT.
A. CFSE-labeled PBMC from an LTx-recipient were stimulated for 6 days with allogeneic splenocyte-derived CD40-B cells or with splenocytes from the same donor. Dot-plots and CFSE-dilution graphs of CD3+ T cells show increased T-cell proliferation upon stimulation with CD40-B cells compared to splenocytes. Percentages in dot plots depict % dividing (CFSElow) T cells. Percentages in histograms are calculated PF. B: Paired comparisons of PF of LTx-recipient CD3+, CD4+ and CD8+ T cells upon stimulation with donor-derived CD40-B cells, autologous patient CD40-B cells, splenocytes or without stimulus. Sixty CFSE-labelled PBMC-samples of 6 LTx-recipients, obtained either before, or at different time points after transplantation, were stimulated with donor-derived or autologous CD40-B cells or with splenocytes from the same donor for 6 days. Bars represent median values. C: Donor-specific T-cell responses obtained by subtraction of PF reacting to autologous CD40-B cells from PF responding to donor-derived CD40-B cells, or subtraction of PF in the absence of allo-antigen (negative controls) from PF responding to donor splenocytes. Bars represent median values. D: Paired comparisons of the coefficients of variation of triplicate measurements of LTx-recipient CD3+ PF in 108 PBMC-samples of 6 LTx-recipients upon stimulation with donor-derived CD40-B cells or donor-derived splenocytes. Bars represent median values. E. Flowcytometry dotplot showing CFSE-dilution versus intracellular IFN-γ of CD3+ T cells stimulated with autologous or allogeneic CD40-B cells, and re-stimulated at day 5 for 24 hours with CD40-B cells of the same donor, the last 15 hours in the presence of Brefeldin A. Only T cells that divided (CFSElow) in response to allogeneic CD40-B cells produce IFN-γ. F. Comparison of CFSE-MLR with IFN-γ ELISPOT. Four different CFSE-labeled PBMC samples from LTx-recipients were stimulated for 5 days with allogeneic splenocyte-derived CD40-B cells, and re-stimulated for 24 hours with CD40-B cells of the same donor to detect intracellular IFN-γ expression. In parallel, samples of the same PBMC were analyzed for IFN-γ production upon stimulation with the same CD40-B cells in IFN-γ ELISPOT. IFN-γ-producing cells in ELISPOT are depicted as percentage of PBMC, while the percentages of IFN-γ producing cells in CFSE-MLR are depicted as percentages of CD3+ T cells.

