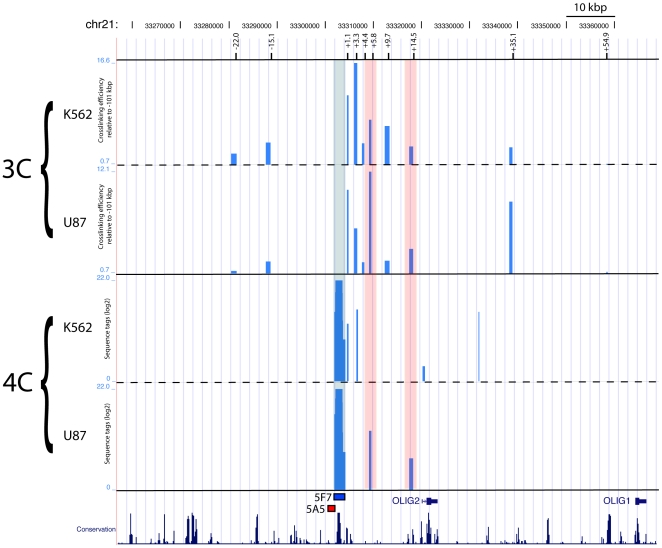
Figure 6. 3C and 4C interactions between 5F7 and Olig2.
3C and 4C interactions between 5F7 and OLIG2 in K562 and U87 cells. 3C: Crosslinking efficiency was measured for each probes relative to a fully digested/ligated BAC (RP11-760B14; chr21: 33199567–33414452) and then ploted relative to a probe located 102 kb upstream of 5F7 where crosslinking is expected to be at background levels (the −102 kbp site is not shown here). 4C: A DpnII fragment containing clone 5F7 was used as bait. The vertical lines correspond to the log2 of the number of tags recovered by the bait in K562 and U87 cells. The peak at the bait represents self-ligation of 5F7.The position of 5F7 is indicated by a light blue strip whereas the U87 4C-specific interactions are indicated by light-red strips.

