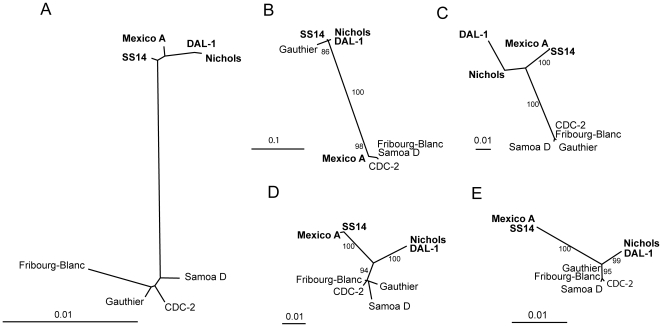
Figure 4. The unrooted trees constructed from sequences of genes showing major differences in strain clustering.
A An unrooted tree constructed from the binary RTS data without Cuniculi A data. Bar scale represents 0.01 restriction target site substitutions per RTS. The unrooted trees constructed from sequences of 4 treponemal genes including TP0131, TP0136, TP0548, and TP1031 are shown in panel B, C, D, and E, respectively. Bar scale represents 0.01 nucleotide substitutions per site. Bootstrap values based on 1,000 replications are shown next to branches. T. p. pallidum strains causing syphilis are shown in bold.

