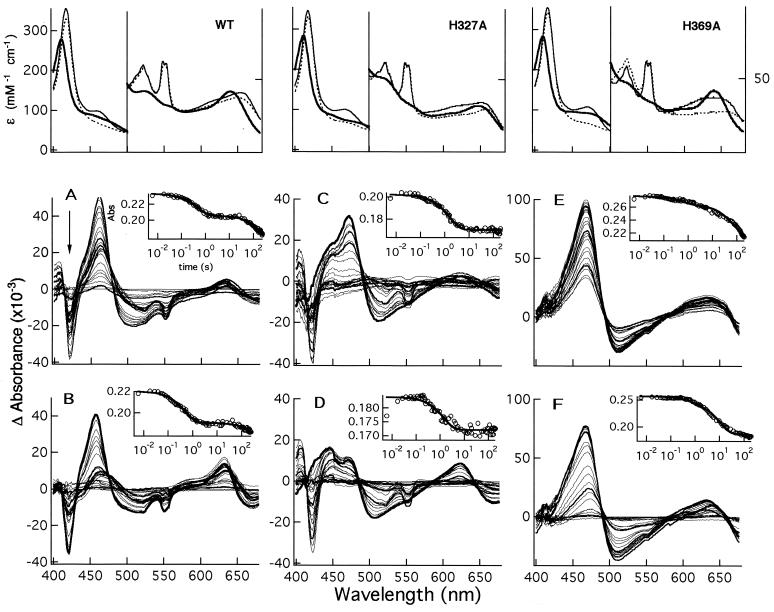
Figure 2.
Static and transient optical spectra of wt and mutants Pa-NIR. (Upper) Absolute spectra of the oxidized (bold line), reduced (thin line), and reduced NO (dotted line) derivatives for the wt NIR (Left), mutant H327A (Center), and mutant H369A (Right). (Lower) Time evolution of the kinetic difference spectra observed for the same proteins, after the reduced enzyme is mixed with nitrite anaerobically. The two sets of difference spectra for each protein refer to experiments carried out at the lowest (10 μM; A, C, and E) and the highest (0.15 or 0.5 mM; B, D, and F) nitrite concentrations. The arrow indicates the direction of the time course, from 6 ms to 245 s. To better follow the spectral evolution with time, the difference spectra at selected times (6 ms and 1, 25, and 180 s) are drawn as thick lines. The insets show the time course as followed at the maximum of reduced d1-heme (462 nm for the wt and 472 nm for the two mutants), fitted to two or three exponentials (continuous lines). Kinetic experiments were carried out in 50 mM phosphate buffer (pH 8.0) and 25°C.

