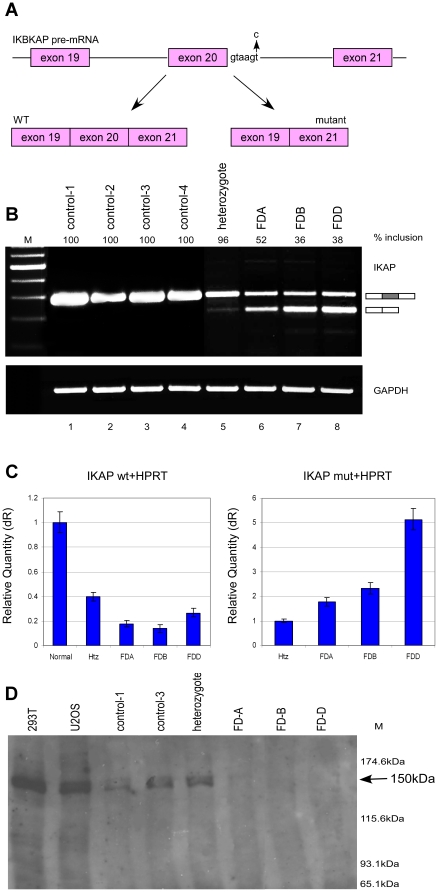
Figure 1. Expression of IKAP mRNA and protein in FD cells.
(A) Schematic diagram illustrating the area in IKAP responsible for FD. The FD mutation at position six of exon 20 splice donor site is shown by an arrow. In FD patients, two mRNA isoforms, one containing exon 20 and one without, can be present. (B) RT-PCR analysis of IKAP mRNA. RNA was extracted from control, heterozygous and FD cells and the endogenous splicing products were separated on a 2% agarose gel after RT-PCR reaction using primers to exon 19 and 21. Isoforms were quantified using ImageJ. GAPDH was used as control for cDNA amounts. (C) QPCR analysis of the IKAP mRNA. Left side: Level of exon 20 inclusion isoform (wt). Relative quantity represents normalization to control cells. Right side: Level of exon 20 skipped isoform (mut). Relative quantity represents normalization to heterozygous (Htz) cells. All values were normalized to HPRT mRNA. QPCR experiments were amplified in triplicate; results shown are mean values ± SD. (D) Analysis of IKAP protein levels. Western blotting of extracts from the indicated cell lines using an anti-IKAP antibody (Santa Cruz Biotechnology, D-17). Band intensities were quantified using ImageJ.

