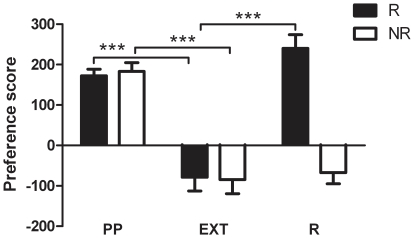
Figure 1. Reinstatement of conditioned place preference in reinstating (R) and non-reinstating (NR) mice (n = 11–16 per group).
The preference score is shown over the three time points; the place preference (PP) test day, the test day following extinction (EXT) and reinstatement day (R). Preference score = time spent in drug-paired side minus time spent in saline-paired side on test day; *** p<0.001 compared to preference score after extinction for that group (two-way ANOVA with post hoc SNK multiple comparison test).

