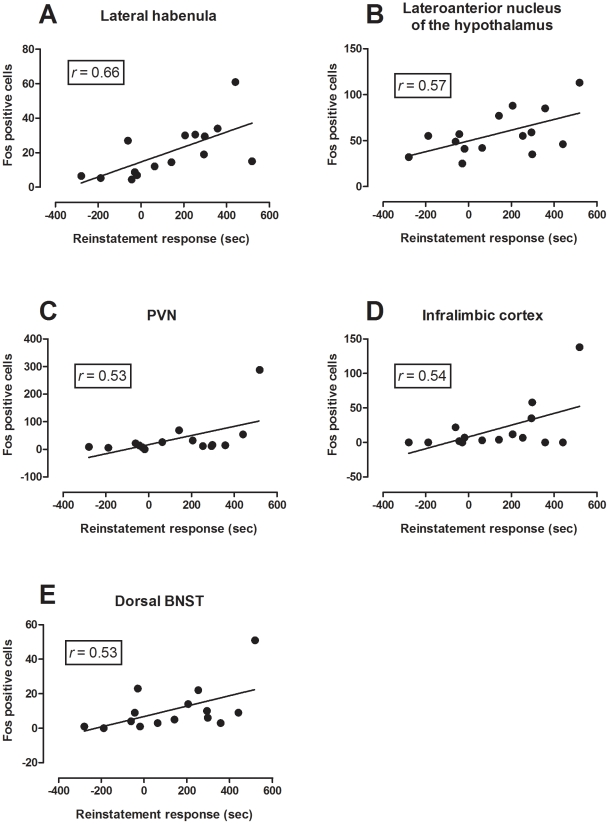
Figure 10. Scatter plots showing the correlation between reinstatement behaviour and Fos expression in the five brain regions where significant correlations were found (n = 15).
Reinstatement preference score = time spent in drug-paired side minus time spent in saline-paired side on test day. Fos-positive cells = mean of the number of Fos-immunoreactive cells counted for that region (± SEM). The line represents significant linear correlation (p<0.05) between Fos-positive cells and reinstatement score as measured by Pearson's correlation test.

