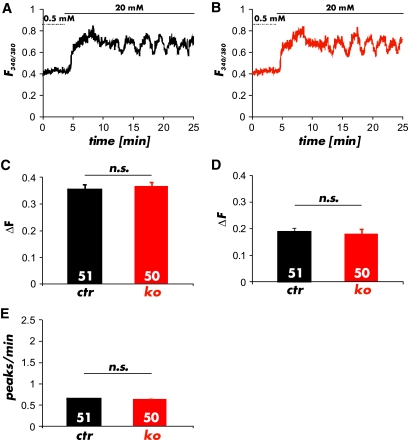
FIG. 5.
Ca2+ imaging of pancreatic β-cells in whole islets. A and B: Representative changes of [Ca2+]i induced by 20 mmol/l glucose showed no differences between (A) control (black) and (B) cGKI-KO (red) islets. C: Average peak amplitude of Ca2+ oscillations at the initial perfusion of 20 mmol/l glucose and (D) during prolonged incubation recorded from control (CTR) and cGKI-KO (KO) islets. E: Peak frequency of Ca2+ oscillations determined in control (CTR) and cGKI-KO (KO) islets in the presence of 20 mmol/l glucose. In total, 51 CTR and 50 KO cells were analyzed from 10 and 9 individual islets, which were isolated from 4 CTR and 3 KO mice, respectively. (A high-quality color representation of this figure is available in the online issue.)

