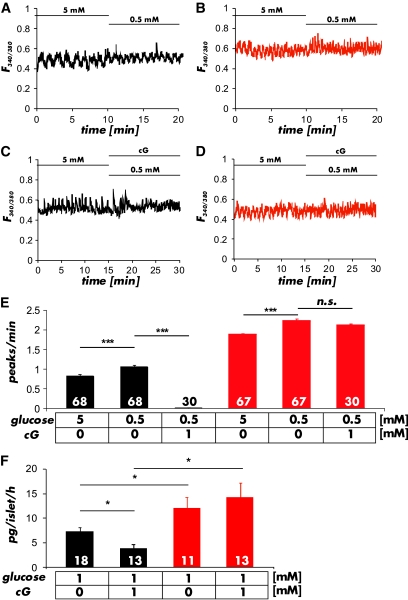
FIG. 6.
Ca2+ transients of pancreatic α-cells measured in whole islets. A and B: Representative changes in FURA-2 fluorescence ratios at 5 mmol/l and 0.5 mmol/l glucose measured in control (black) and cGKI-KO (red) islets. C and D: Representative Ca2+-transients measured in the presence or absence of 8-Br-cGMP (cG; 1 mmol/l) in control (black) and cGKI-KO (red) islets. E: Summary of the experiments shown in A–D. The frequency of Ca2+ oscillations at 5 mmol/l and 0.5 mmol/l glucose was significantly higher in cGKI-KO islets and was not reduced by the addition of 8-Br-cGMP (1 mmol/l). The numbers of cells that were measured under the particular conditions are given in the respective panels. Cells were from 14 CTR and 9 KO islets isolated from 5 CTR and 3 cGKI-KO mice, respectively. F: The release of glucagon was significantly increased in isolated cGKI-KO (ko) islets (red bars). 8-Br-cGMP (1 mmol/l) had no effect on the release rate of cGKI-KO islets, but suppressed glucagon release of control (ctr) islets (black bars) (*P < 0.05; ***P < 0.001). (A high-quality color representation of this figure is available in the online issue.)

