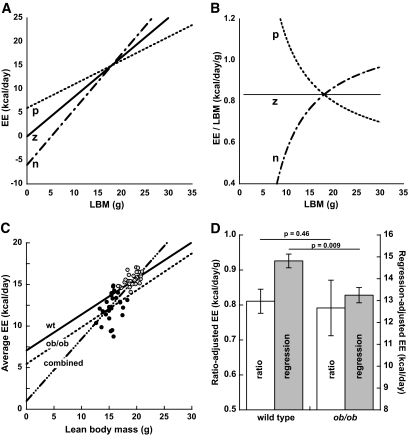
FIG. 1.
Illustration of the confounding effect of traditional ratio-based EE normalization contrasted with multiple regression analysis to control for LBM disparity. A and B: Nonzero y-intercept values confound normalization using EE/LBM. Linear regression prediction lines for mean EE values as a function of LBM can potentially have a positive (p), zero (z), or negative (n) y-intercept depending on the data (A). Fits of average daily or resting EE typically entail a positive y-intercept, whereas measures of peak or maximal EE typically entail a negative y-intercept. If the y-intercept is positive, ratios formed by dividing EE by LBM are confounded since they produce normalized EE values that decrease as LBM increases, whereas if the parent relationship has a negative y-intercept, LBM ratio-normalized EE increase as LBM increases (B). Zero-value y-intercepts arguably justify the use of ratio normalization but such relationships are uncommon, and even small departures from zero can significantly confound group comparisons (28). C and D: Comparison of ratio- vs. regression-based analysis of average daily EE controlling for LBM disparity in lean male WT C57BL/6J (circles with dots; aged 8–12 weeks; n = 32) and genetically obese ob/ob mutant mice (filled circles; aged 10–13 weeks; n = 28). EE (indirect calorimetry) was regressed on LBM (quantitative magnetic resonance) using the combined data from both genotypes (C; labeled “combined”). Although the resultant, small positive y-intercept suggests that traditional ratio normalization might be appropriate for analysis of group differences, this analysis indicates no significant EE phenotype difference between groups, whereas analysis by multiple regression discloses a significant reduction of EE in the ob/ob mice after controlling for differences in body composition (D). The offset of the two regression lines (i.e., the difference between their y-intercepts) in C corresponds to the adjusted group difference in EE. For additional analysis details see supplementary materials.

