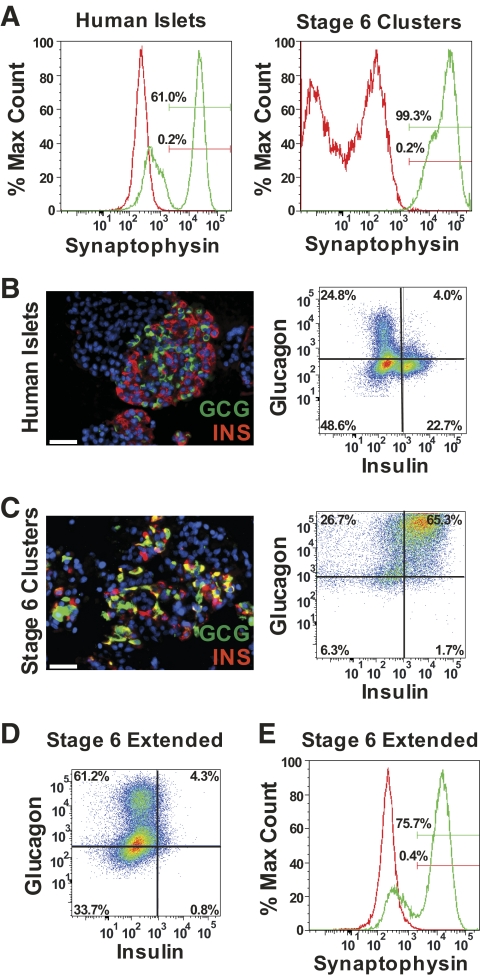
FIG. 2.
Morphologic characterization of hES cell–derived cells. A: Representative flow analysis of synaptophysin expression in isolated human islets (left) and stage 6 clusters (right). Isotype shown in red. B: Representative glucagon (GCG) and insulin (INS) immunofluorescence images in paraffin-sectioned adult human islets (left) and flow data from dispersed adult human islets (right). GCG immunoreactivity is shown in green and INS immunoreactivity is shown in red. Scale bar, 50 μm. Quadrant gates set using isotype controls (not shown). C: Representative GCG and INS immunofluorescence images in paraffin-sectioned stage 6 clusters (left) and flow data from dispersed stage 6 clusters (right). GCG immunoreactivity is shown in green and INS immunoreactivity is shown in red. Cells expressing both GCG and INS are shown in yellow. Scale bar, 50 μm. Images in B and C include a DAPI nuclear stain (blue). Quadrant gates set using isotype controls (not shown). D: Representative GCG and INS flow data from dispersed stage 6 clusters after an extended 4-week culture period. Quadrant gates set using isotype controls (not shown). E: Representative synaptophysin expression in stage 6 clusters dispersed after an extended 4-week culture period. Isotype shown in red. (A high-quality color representation of this figure is available in the online issue.)

