FIG. 1.
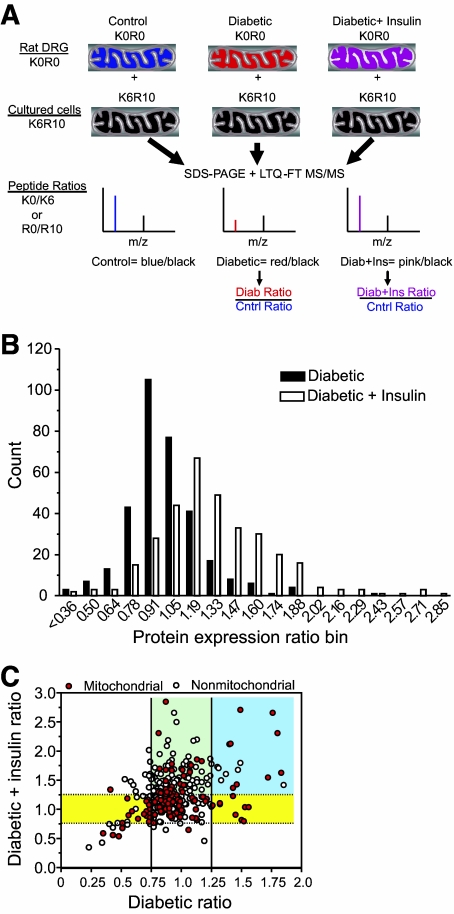
A: Schematic for use of culture-derived isotope tags for quantitative proteomics. Unlabeled (K0R0) mitochondrial fractions were prepared from the lumbar DRGs obtained from each animal in the three treatment groups. Each K0R0 mitochondrial fraction was mixed in a 2:1 ratio with K6R10-labeled mitochondria obtained from SC16 cells that had been metabolically labeled with 13C6 lysine (K6) and 13C6,15N4 arginine (R10) for 10 days. The proteins were resolved by SDS-PAGE, digested with trypsin, and analyzed by RP-HPLC/LTQ-FT MS/MS. For each protein, the ratio of K0R0 to K6R10 quantifies the endogenous protein relative to the internal standard. Dividing the protein ratios obtained in the diabetic or diabetic + insulin treatment by those obtained from control animals cancels out the K6R10 internal standard and provides the fold control value. B: Effect of diabetes and insulin therapy on mitochondrial protein expression. The protein expression ratios from the diabetic and diabetic + insulin treatments were binned and the number of proteins per bin counted. C: To determine the effect of diabetes and insulin therapy on mitochondrial versus nonmitochondrial proteins, the expression ratio for each protein was plotted against each treatment. Solid and dotted lines demarcate the threshold necessary for proteins to show a significant change in the diabetic and diabetic + insulin treatments, respectively. Proteins in between dotted and solid lines did not change with either treatment. Yellow shading indicates proteins that were significantly up- or downregulated by diabetes and normalized by insulin therapy. Blue shading indicates proteins that were increased by diabetes but not normalized by insulin therapy. Green shading indicates proteins not affected by diabetes but increased by insulin therapy.

