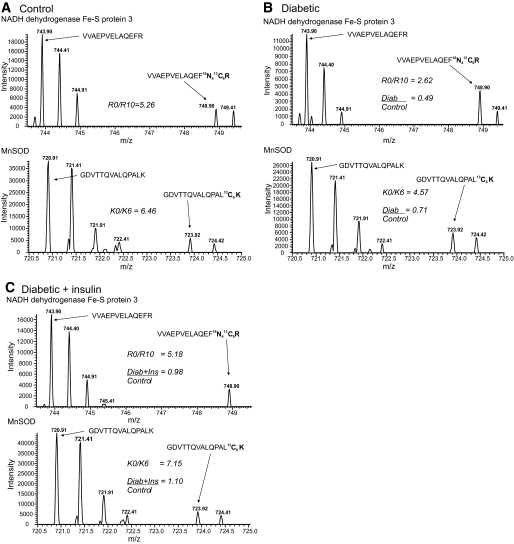
FIG. 2.
Representative peptide mass spectra showing the effect of diabetes and insulin therapy on NDUFS3 and MnSOD. A: The upper spectrum shows the doubly-charged ion of the unlabeled (m/z 743.90) and R10 labeled (m/z 748.90) VVAEPVELAQEFR peptide of NDUFS3 from a control animal. Since the peptide is doubly charged, the mass difference is 5 atomic mass units; and the other peaks represent the isotopic envelope of the monoisotopic peak. The lower spectrum shows the doubly-charged ion of the unlabeled (m/z 720.91) and K6 labeled (m/z 723.91) GDVTTQVALQPALK peptide of Mn-SOD from a control animal. Since the peptide is doubly charged, the mass difference is 3 atomic mass units; and the other peaks represent the isotopic envelope of the monoisotopic peak. The R0/R10 and K0/K6 ratios for these peptides are indicated. B: Upper and lower spectra show the same NDUFS3 and Mn-SOD peptides, but from a diabetic animal. The K0R0/K6R10 ratios for each peptide are indicated and the Diab/Control ratio were obtained after dividing by the control ratios from panel A. C: Upper and lower spectra show the same NDUFS3 and Mn-SOD peptide, but from a diabetic + insulin-treated animal. The K0R0/K6R10 ratios for each peptide are indicated and the Diab/Control ratio were obtained after dividing by the control ratios from panel A. Note that the intensity of the K6 and R10 peptides are very similar between the treatments (A–C), indicating that the changes in protein expression are minimally influenced by the internal standard.

