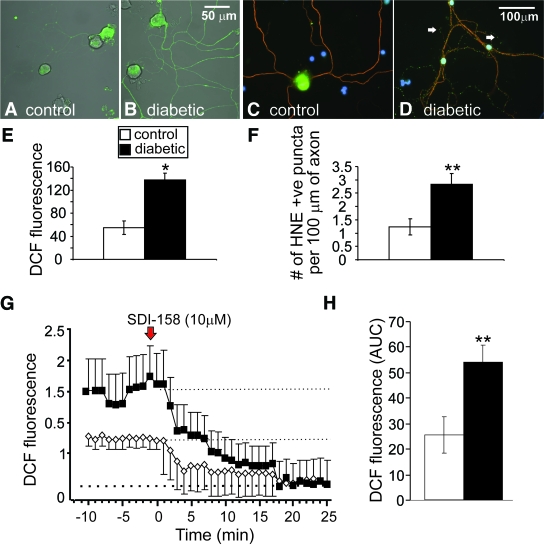
FIG. 5.
Axons of sensory neurons from STZ-diabetic rats exhibit elevated oxidative stress that is ameliorated by the blockade of SDH. Images of ROS levels in axons at 24 h in adult DRG neuron culture from (A) control and (B) STZ-diabetic rats. Cultures were stained for ROS using CM-H2DCFDA dye (DCF is the fluorescent product resulting from oxidation). E: Quantification of ROS accumulation in axons. Values are means ± SEM, n = 44–57 axons, *P < 0.05 by t test. Immunofluorescent images of accumulation of adducts of 4-HNE in axons in sensory neuron cultures after 3 days; (C) is control and (D) is diabetic culture. F: Level of accumulation of puncta of adducts of 4-HNE in axons. Values are means ± SEM, n = 19–27 axons, **P < 0.01 by t test. G: Trace of DCF-fluorescence signal in the axons of cultured DRG neurons isolated from age-matched controls and STZ-diabetic rats and treated acutely with 10 μmol/l SDI-158. DCF fluorescence trace was characterized by nonlinear regression (one phase exponential decay). K = 0.09 ± 0.02 (control) and 0.13 ± 0.009 (diabetic). Half-life of decay = 7.5 min (control) and 5.5 min (diabetic). F ratio = 50.33, P < 0.0001, control versus diabetic. The red arrow indicates point of injection of SDI-158. H shows the area under the DCF fluorescence trace (AUC) for control (open bar) and diabetic (filled bar) neurons. The AUC was estimated from 0.2 to 1.6 on fluorescence axis and between time points 0 to 22 min using sums of squares (dotted lines show upper and lower limits). Values are means ± SEM, n = 42–51 axons; **P < 0.01 compared with control by t test. (A high-quality digital representation of this figure is available in the online issue.)

