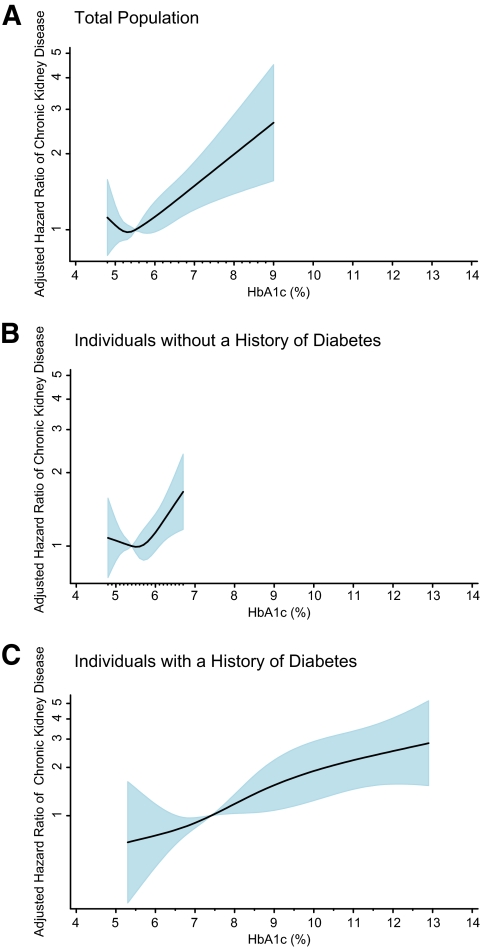
FIG. 2.
Adjusted HR of incident chronic kidney disease according to baseline glycated hemoglobin value. The figures show adjusted HRs from restricted cubic spline models. The shaded area is the 95% CI. The models are centered at the median (5.5%, 5.4%, and 7.4% in the total population, nondiabetic, and diabetic participants, respectively) and truncated at the 2.5th and the 97.5th percentiles of glycated hemoglobin in each population. The HRs were adjusted for age, sex, and race (black or white), low-density and high-density cholesterol levels, log transformed triglyceride level, BMI, waist-to-hip ratio, hypertension (yes or no), family history of diabetes (yes or no), education (less than high school, high school or equivalent, or college or above), alcohol use (currently, formerly, or never), physical activity index score, and smoking status (current smoker, former smoker, or never smoked). The model in A is further adjusted for diabetes medication use. The data are shown on a natural-log scale. (A high-quality color representation of this figure is available in the online issue.)

