FIG. 3.
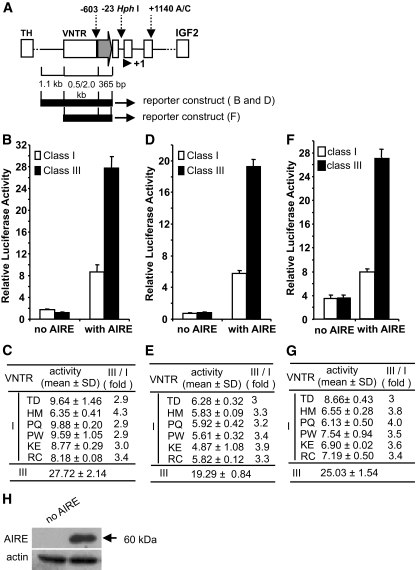
IDDM2-VNTR locus transduces a quantitative insulin expression signal in the presence of AIRE. A: Diagrammatic representation of the TH-INS-IGF2 interval on chromosome 11p15.5. INS or IDDM2 locus is bordered by TH (tyrosine hydroxylase) and IGF2 (insulin-like growth factor 2) loci. The three polymorphisms are designated by their positions with respect to the first base of the INS start codon that is represented by a solid triangle and marked as +1. The allelic variations at the VNTR begin at −603, positioned immediately before the basal promoter. The average length of a class I VNTR is ∼0.5 kb among the alleles we cloned and the class III used is ∼2.0 kb. A gray arrow depicts the basal insulin promoter region (365 bp) and open boxes denote the three insulin exons. The black bold lines represent the regions cloned into the luciferase reporter constructs including the VNTR, its 5′-flanking 1.1 kb region, the basal insulin promoter, and excluding the other two polymorphisms. The longer version bearing the 5′-flanking 1.1 kb in addition to the VNTR region and basal promoter construct, as well as a shorter construct without the 1.1 kb 5′-flanking region, were analyzed. B: A luciferase reporter gene is driven by class I or class III VNTR with insulin basal promoter (50 ng) and transfected in a hTEC line. Six class I and one class III haplotypes were tested. The relative activities both without (β-gal control) and with exogenous AIRE (50 ng) are shown. The class I activity was expressed as an average of six constructs. The class III activity was expressed as an average of three experiments from one construct. C: Detailed activities of each individual VNTR allele in the presence of AIRE were tabulated. D and E: The same set of constructs was assayed using rat primary thymic epithelial cells following the same strategy as in B and C. F and G: To rule out the possibility that the upstream 5′-flanking genomic region (∼1.1 kb) might contribute to the differential insulin expression in thymus, another set of constructs was made by removing this region (A) and assaying in the hTEC line. The average difference in thymic expression is consistently a threefold increase of class III over I VNTR haplotypes. H: Western blot analysis to verify AIRE expression in the transfected cell line. As a loading control, α-actin was used.

