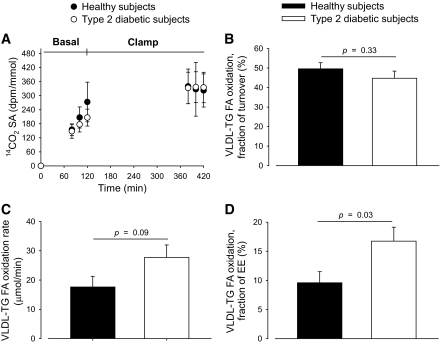
FIG. 4.
Breath 14CO2 SA steady state was reached in the clamp period, but not in the basal period (A). Therefore, only VLDL-TG FA oxidation data from the clamp period are illustrated and analyzed statistically. VLDL-TG FA oxidation expressed as fraction of secretion (B) and as oxidation rate (fractional oxidation × VLDL-TG secretion rate) (C). VLDL-TG FA oxidation as fraction of EE (D). Black circles and bars, healthy subjects; open (white) circles and bars, type 2 diabetic subjects. Data are mean ± SEM.

