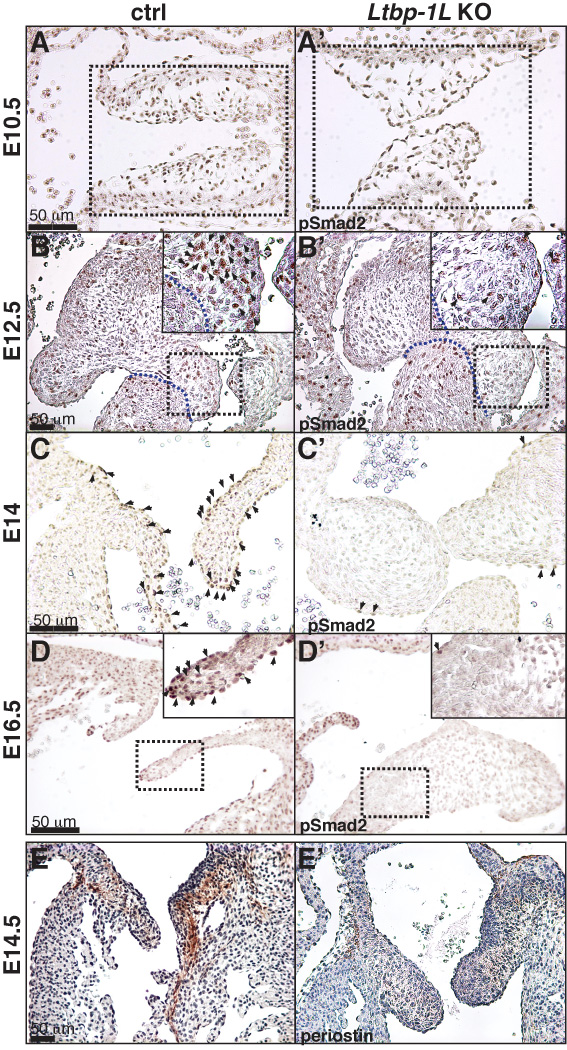
Figure 5. Tgf-β signaling during valve development of Ltbp1L nulls.
Distribution of pSmad2 in E10.5 (A, A’), E12.5 (B, B’), E14 (C, C’) and E16.5 (D, D’) control (A, B, C, D) and Ltbp1L−/− (A’, B’, C’, D’) AVC. Box areas in A and A’ represent AV cushions (superior upper, inferior lower). Box areas in B, B’, D and D’ are magnified to show mesenchymal cell-specific attenuation of Smad2 phosphorilation. Arrows indicate nuclear accumulation of pSmad2. E-E’. Immunolocalization of periostin in control (E) and Ltbp1L−/− (E’) E14.5 mitral valves.

