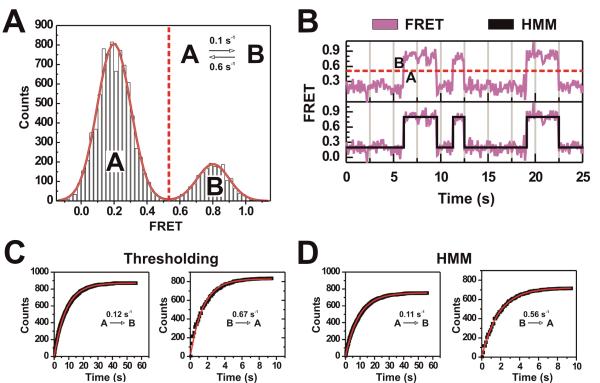
Figure 2. Histogram distribution analysis, thresholding, and hidden Markov modeling are well suited for simple trajectories.
(A) Simulated FRET probability distribution created by simulating 10 s at 100 ms repetition rate (1,000 data points) each of 100 molecules based on a two-state model (inset). The distribution was fit using two Gaussians whose sum models the distribution well (red outline). The centers of the Gaussians as determined by the fitting routine are situated at 0.203 and 0.802. (B) A sample trajectory of the simulated two-state system with discrete FRET states determined through either thresholiding (top) or hidden Markov modeling (HMM) (bottom). (C) Dwell time analysis of the simulated two-state system after determining the dwell times using the thresholding method or HMM. Measured dwell times were binned and plotted as a cumulative distribution and then fit with single-exponential functions using Microcal Origin.

