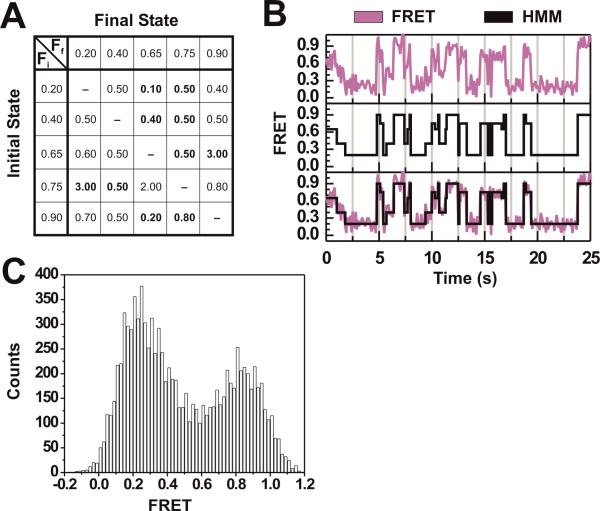
Figure 3. Complex trajectories are not amenable to thresholding and distribution analysis, but require hidden Markov modeling.
(A) Parameters used for simulating a five-state system. FRET states and their transition rate constants are depicted as a transition matrix with the slowest and fastest rate constants (all in s−1) in bold. Fi = initial FRET state; Ff = final FRET state. (B) Raw FRET trajectory of one exemplary molecule simulated with the parameters in Fig. 3A (top). The idealized trajectory as determined by HMM executed in QuB (middle) and both trajectories overlaid (bottom). (C) FRET probability distribution of the simulated five-state system. This histogram shows that even in simulated data the five underlying states are obscured by noise, rendering distribution analysis less informative as in simple two-state systems.

