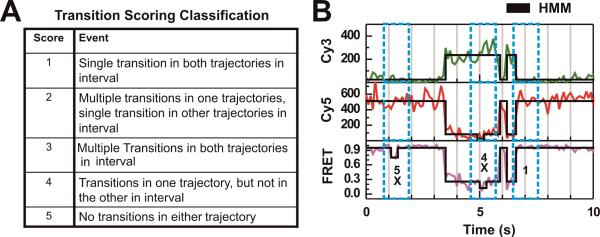
Figure 4. Local correlation analysis utilizing HMM algorithms and transition scoring.
(A) Transition quality scoring used to exclude artificial FRET transitions caused by unilateral changes in one fluorophore. In our studies we are interested in only transitions with scores 1–3, since these transitions exhibit anti-correlated changes in the fluorescence intensity of both fluorophores simultaneously, as indicated. The time-window used to search for transitions in the donor and acceptor trajectories is set by examining the FRET trajectory. The size of the time window we chose to relate to the dwell time immediately before the FRET transition being scored. (B) Experimental trajectory and the scores of highlighted transitions after idealizing the donor signal, acceptor signal, and FRET using hidden Markov modeling (black lines). Transitions marked with an x are not characterized by donor-acceptor anti-correlation and not considered in any further analysis.

