
Figure 2.
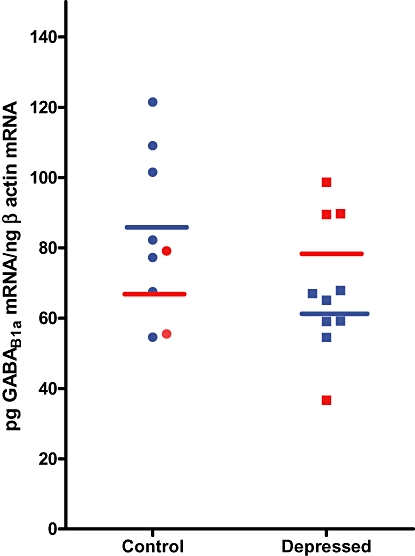
GABAB1a subunit gene expression in the CA3 region of the hippocampus of depressed (n= 6) and control (n= 7) male (blue) and depressed (n= 4) and control (n= 2) female (red) subjects. Horizontal lines indicate the means for each group. The level of significance for the difference between means for the male subjects is P= 0.03, as determined by an independent samples t-test.