Figure 1.

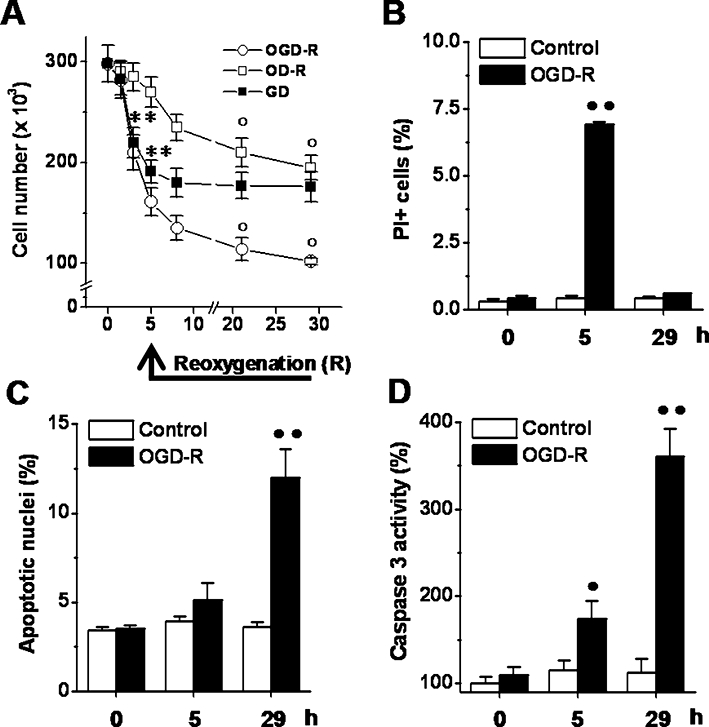
Effects of OGD-reoxygenation on podocyte death. (A) Cells were exposed to OGD (1.5–5 h)-reoxygenation (3–24 h), GD (1.5–5 h) or OD (1.5–5 h)-reoxygenation (3–24 h) and the cell number were determined at the indicated time points. (B–D) Cells were exposed to OGD (5 h)-reoxygenation (24 h) and the parcentage of PI+ cells (B), that of apoptotic nuclei (C) and the caspase 3 activity (D) were determined at the indicated time points. Results are expressed as mean ± SEmean of four experiments run in triplicate. **P < 0.01 versus basal levels; °P < 0.01 versus 5 h-OGD, -GD or -OD; •P < 0.05; ••P < 0.01 versus control.
