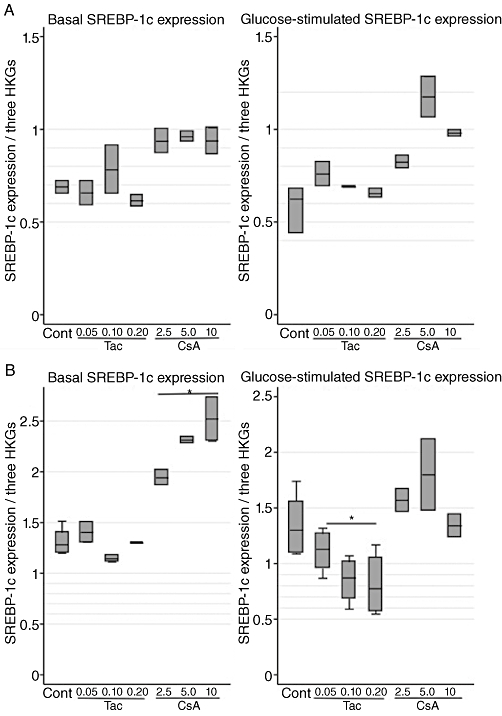
Figure 4.

Effects of tacrolimus (Tac; µmol·L−1) and cyclosporin (CsA; µmol·L−1) on relative gene expression of SREBP-1c (normalized to β-actin, clathrin and HSP) in INS-1E cells. (A) Six hours of incubation at basal (6.6 mmol·L−1) and stimulatory (16.7 mmol·L−1) glucose concentrations. Data are medians with range. n= 3 for controls and n= 2 for each drug concentration. (B) Twenty-four hours of incubation at basal (6.6 mmol·L−1) and stimulatory (16.7 mmol·L−1) glucose concentrations. Data are medians with range. n= 3 for controls and n= 2 for each drug concentration. *P= 0.03 versus control, Kruskal–Wallis test. HKG, housekeeping gene.
