
Figure 2.
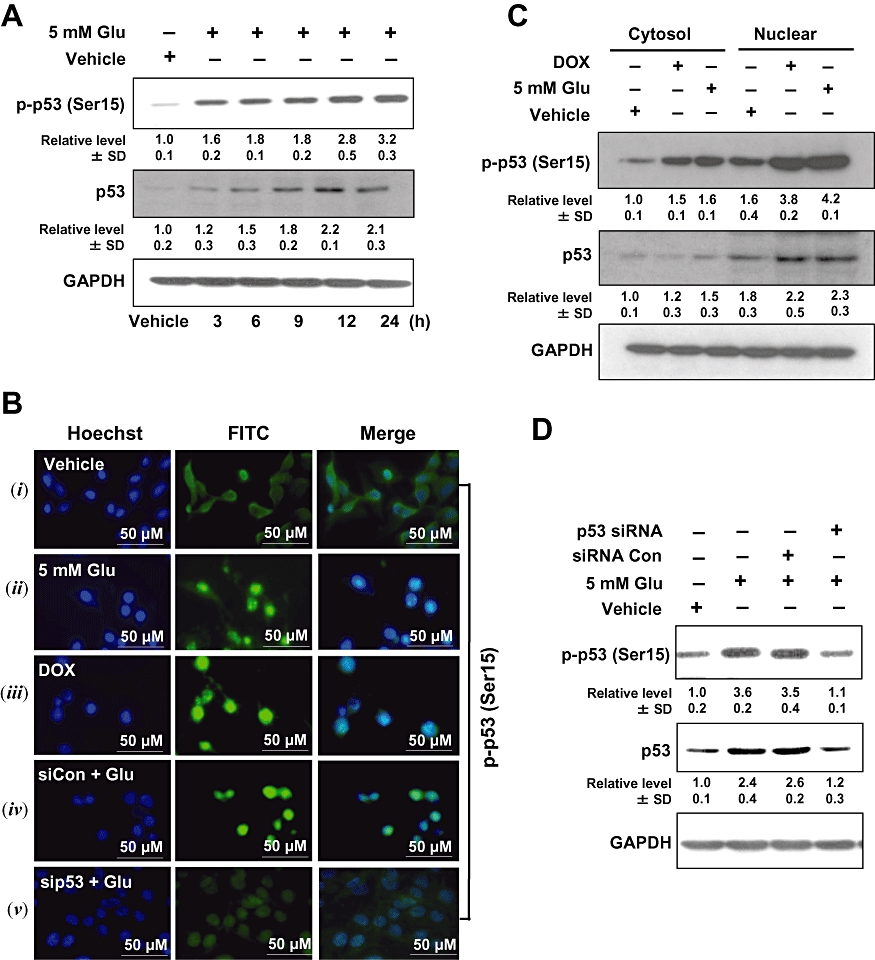
Glutamate induces p53 activation in HT22 cells. (A) HT22 cells were incubated with 5 mmol·L−1 glutamate for the indicated length of time. Whole cell extracts were examined by Western blotting using the anti-phospho-p53 (Ser15) and anti-p53 antibodies. (B –i, ii) Subcellular localization of phospho-p53 (Ser15) in the control and glutamate-treated HT22 cells using immunofluorescence staining. (B –iii) Nuclear localization of phospho-p53 (Ser15) after exposure of cells to doxorubicin (DOX). (B –iv, v) Cells were transfected with p53 siRNA (sip53) or control siRNA (siCon), and 24 h later, they were exposed to 5 mmol·L−1 glutamate for additional 24 h. They were then analysed for immunofluorescence staining of phospho-p53 (Ser15). Data shown are representative of three independent experiments. (C) Subcellular localization of phospho-p53 (Ser15) and p53 in HT22 cells during glutamate-induced cell death. Cytosolic and nuclear extracts were prepared from glutamate-treated cells, and the phospho-p53 protein was analysed using Western blotting. Here DOX (at 2 µg·mL−1) was used as a positive control for p53 induction. (D) Cells were transfected with p53 siRNA (sip53) or control siRNA (siCon), and 24 h later cells were treated with 5 mmol·L−1 glutamate (Glu) for additional 24 h. Then the whole cell lysates were analysed for the levels of phospho-p53 (Ser15) and p53 by Western blotting. The relative protein levels were calculated according to their densitometry readings, which were then normalized according to the corresponding reading for GAPDH. The corresponding groups without glutamate treatment were arbitrarily set at 1.0. Each value is mean ± SD from three independent experiments.