
Figure 3.
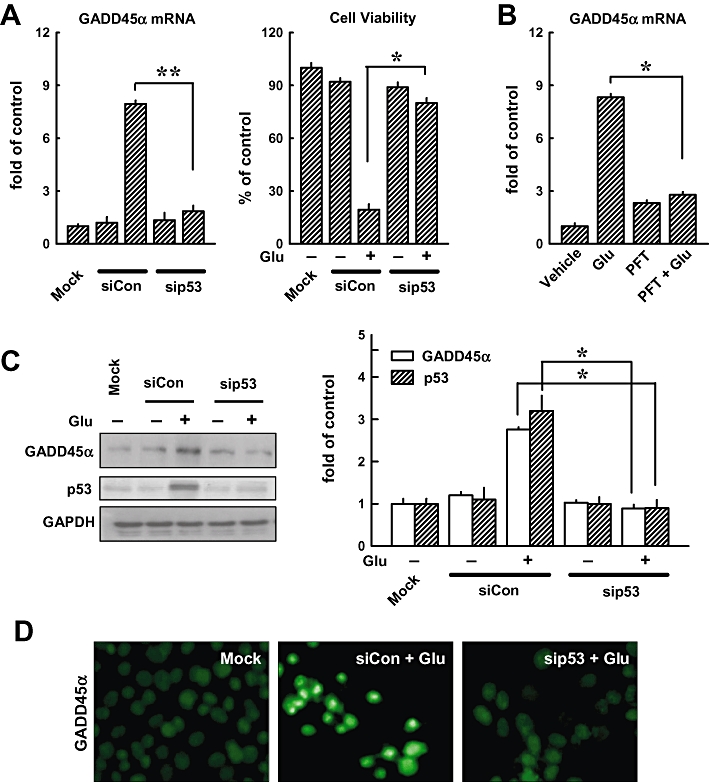
Knock-down of p53 suppresses glutamate-induced GADD45α expression. (A, left panel) HT22 cells were transfected with either the negative control siRNA (siCon) or p53 siRNA (sip53), and 24 h later, cells were exposed to 5 mmol·L−1 glutamate for additional 24 h before analysis of the GADD45α mRNA level by real-time PCR. The method for quantifying the fold of increase in mRNA levels was described in Methods. Glutamate-induced GADD45α expression was compared with the mock transfection procedures (Lipofectamine only). (A, right panel) Cell viability was measured using the MTT assay. Each value is a mean ± SD from three separate experiments. (B) Cells were first pretreated for 1 h with 10 µmol·L−1 PFT-α and then exposed to 5 mmol·L−1 glutamate (Glu) for additional 24 h before analysis of GADD45α mRNA level by real-time PCR. (C, left panel) HT22 cells were transfected with either the negative control siRNA (siCon) or p53 siRNA (sip53), and 24 h later, cells were exposed to 5 mmol·L−1 glutamate (Glu) for additional 24 h before analysis of GADD45α and p53 protein levels by Western blotting. Glutamate-induced GADD45α expression was compared with the mock transfection procedure (Lipofectamine only). (C, right panel) The relative protein levels for GADD45α and p53 were calculated according to their densitometry readings, which were normalized according to the corresponding readings for the GAPDH protein bands. Each value is mean ± SD from three independent experiments. *P < 0.05; **P < 0.01. (D) Cells were transfected with the negative control siRNA (siCon) or p53 siRNA (sip53), and after 24 h, they were exposed to 5 mmol·L−1 glutamate for additional 24 h. They were then analysed for the immunofluorescence staining of GADD45α (original magnification, ×200).