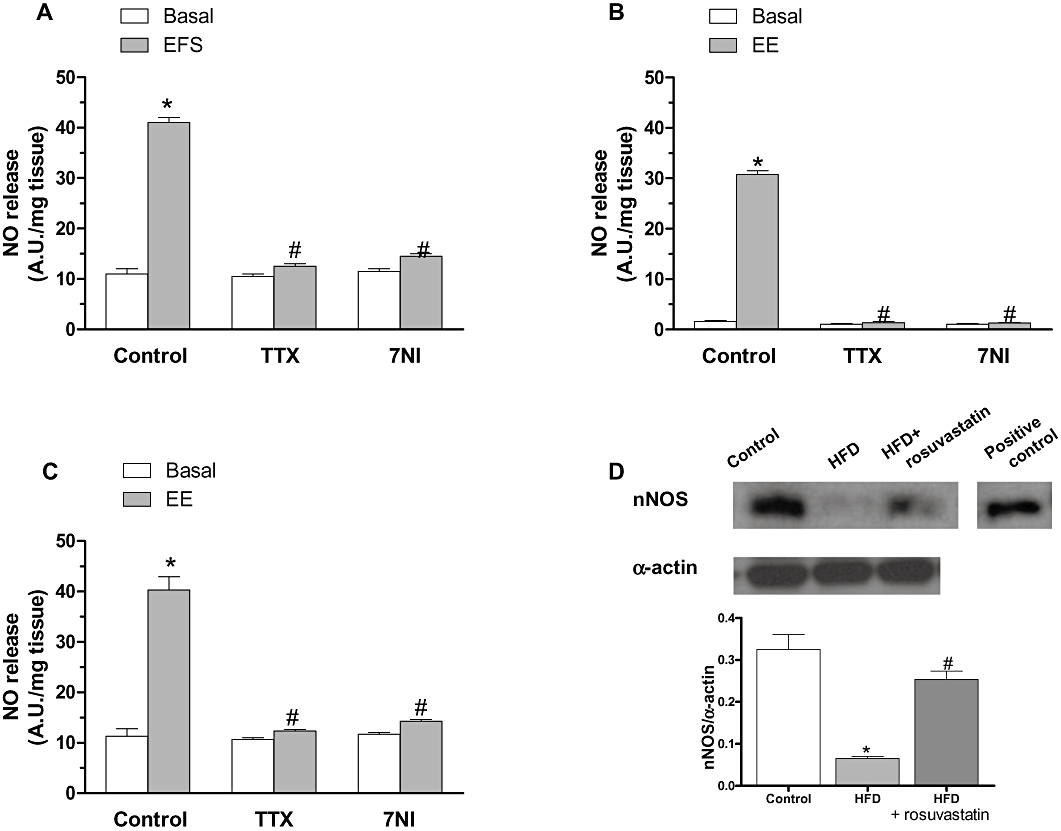
Figure 9.

Effect of preincubation with 0.1 µmol·L−1 tetrodotoxin (TTX) or 0.1 mmol·L−1 7-nitroindazole (7NI) on basal and electric field stimulation (EFS)-induced NO release in segments from control (A), high-fat diet (HFD) (B) and HFD + rosuvastatin (C) rats. Results (mean ± SEM) are expressed as AU mg−1 tissue. *P < 0.05 versus basal; #P < 0.05 versus control. n= 4–6 animals per group. (D) Expression of nNOS in segments from control, HFD and HFD + rosuvastatin rats. The blot is representative of four separate segments from each group. Lower panel shows densitometric analysis of nNOS expression. Results (mean ± SEM) are expressed as the ratio of the signal obtained for nNOS and that obtained for α-actin. *P < 0.05 versus basal; #P < 0.05 versus control; +P < 0.05 versus HFD.
