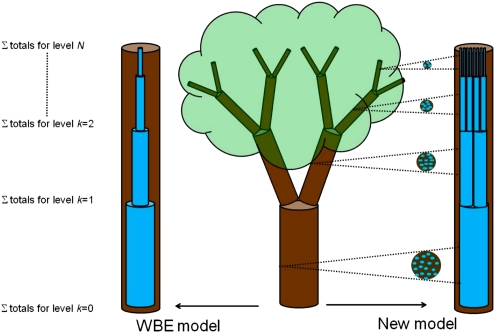
Fig. 1.
Branching structures depicting the difference in internal network structure for our model compared with the WBE model. Trees are labeled from the base (level k = 0) to the terminal twigs (level k = N). The left and right columns represent simplified versions of the models. Both models predict conduit taper, but our model also allows the number of conduits to increase and potentially fill a constant fraction of available wood area (shown to the right).

