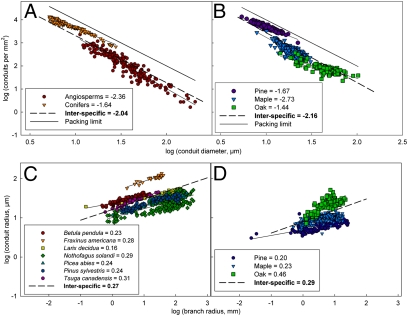
Fig. 3.
Plots of the packing rule and the conduit taper. For the packing rule A is reproduced from ref. 2, and B shows our measurements. For the taper C shows literature data (SI Text; Table S2) and D shows our measurements. Each colored symbol represents a different species. The packing limits in both plots (upper lines) represent wood tissue composed entirely of closest-packed conduits (i.e., the closest packing of both square-shaped conduits in conifers and circular-shaped conduits in angiosperms).

