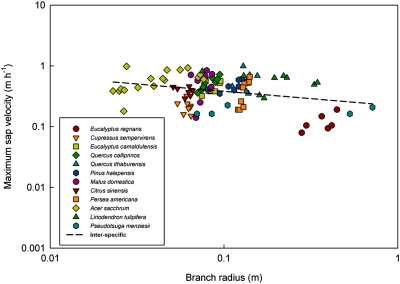
Fig. 4.
Plot of maximum sap velocity (m·h−1) as a function of branch radius (m). Data were compiled from the literature (SI Text; Table S2) and each colored symbol represents a different species. The interspecific trend is nonsignificant (n.s.), matching the predictions of our model and contradicting the WBE model prediction. Intraspecific trends were nonsignificant (n.s. for eight species), significant but measured over a small radius range [much less than a factor of 2 (three species)], or significant for one species, Acer saccharum. Thus, these intraspecific trends support the predictions of our model.

