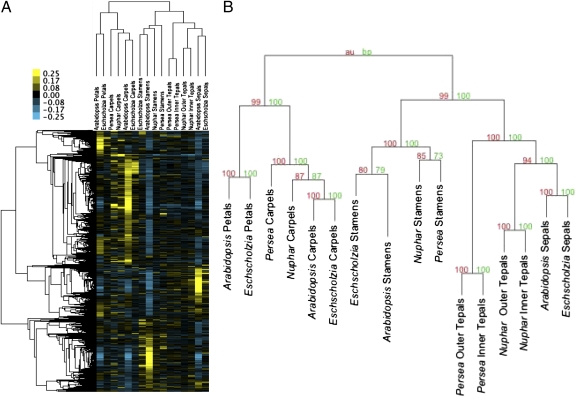
Fig. 3.
Hierarchy of genetic relationships among floral organs supports the process homology of stamens, carpels, sepals, and petals, respectively, and places tepals with sepals in a group collectively closest to stamens. (A) RA scores of expression levels across floral organs within their respective flowers were clustered and subsequently mean centered for visual effect. The color scale ranges from 0.25 (yellow) to −0.25 (blue). (B) Bootstrap (red) and approximately unbiased (green) support values indicate strong stability for all clusters.

