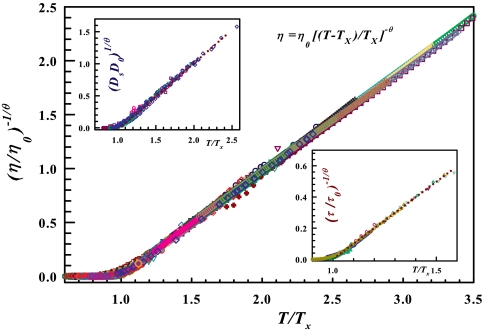
Fig. 2.
Data collapse for the shear viscosity η for 80 different liquids (including the 48 liquids of Fig. 1C, displaying Arrhenius behavior at the lowest T). Shown is the scaled viscosity (η/η0)-1/θ as a function of the scaled temperature T/T×, where T× is the crossover temperature. Whereas 48 liquids of Fig. 1C display an evident crossover, for the remaining 32 liquids (including water of Fig. 1B) we estimate T× using Eq. 2; all fluids are characterized by viscosity values covering at least four orders of magnitude. The scaling exponent θ takes on slightly different values for each of the 80 liquids we studied, with θ ≈ 2 ± 0.3. (Insets) Self-diffusion constant Ds for 12 different liquids, and the characteristic structural relaxation time τ for 8 liquids.

