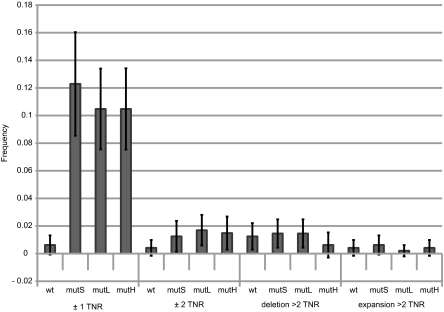
Fig. 4.
Frequencies of changes in CAG·CTG TNR arrays (CTG leading strand orientation) as a function of MMR genotypes. The frequencies of length changes in CAG·CTG TNR arrays were determined by GeneMapper analysis following capillary electrophoresis of 480 individual PCR reactions for each strain, as described in Materials and Methods. Error bars represent 95% confidence limits.

