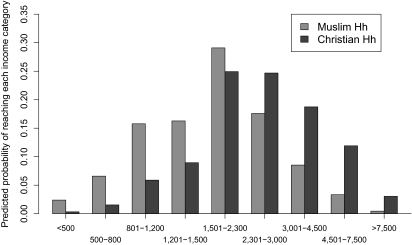
Fig. 3.
Total income effect of Christian vs. Muslim household (Hh). This figure is based on results in Table S4 from Dataset S2 and its codebook (Dataset S3). Predicted probabilities of reaching each income category are calculated for each household. They are then averaged out for Christian households and for Muslim households for cases in which all other independent variables in the model are at their Christian/Muslim household mode. This captures the total effect on household income of being a Christian household vs. a Muslim household. Similar graphs were produced (i) holding all other variables at the sample mode, (ii) holding all other variables at their Christian/Muslim household mean ± 1 SD, and (iii) holding all other variables at the sample mean ± 1 SD. All present the same pattern as that illustrated here.

