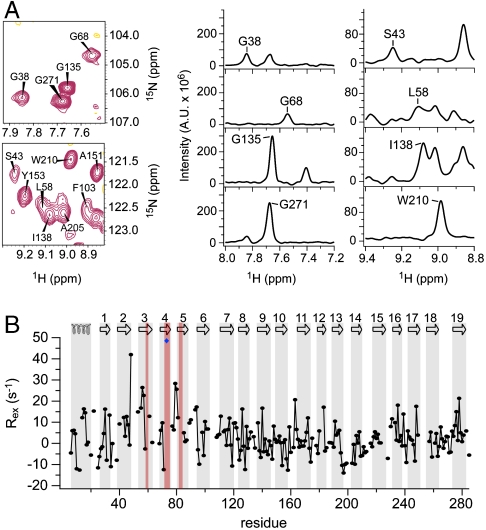
Fig. 1.
μs-ms dynamics are significantly increased for the N-terminal β-strands of VDAC1. (A) Enlarged spectral regions and one-dimensional traces of a 1H,15N-TROSY spectrum of hVDAC1 measured at a 1H frequency of 900 MHz showing examples of broadened and nonbroadened peaks. (B) Chemical exchange rates (Rex) measured at 900 MHz. The topology of VDAC1 is indicated at the top, with secondary structure elements highlighted in gray. Residues that could not be assigned are highlighted in red; E73 is indicated by a blue diamond.

