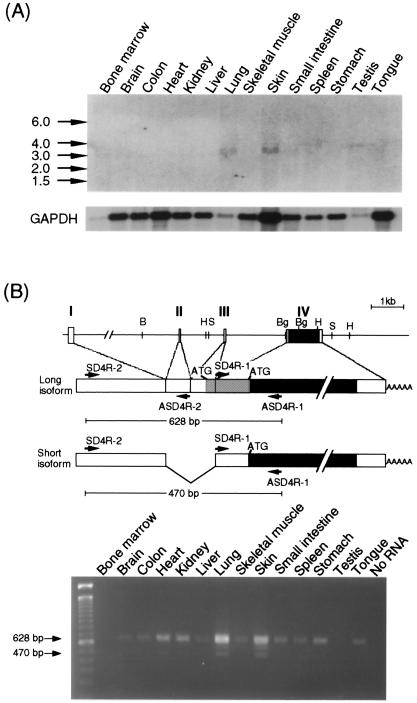
Figure 2.
Expression of the CysLT1 receptor mRNA in mouse tissues. (A) Northern blot analysis with total RNA of C57BL/6 mouse tissues. The upper and lower panels show hybridization with the full-length cDNA for the mouse CysLT1 receptor and a 450-bp fragment of the mouse glyceraldehyde-3-phosphate dehydrogenase (GAPDH) cDNA, respectively. (B) RT-PCR analysis with 100 ng of total RNA from mouse tissues and primers common to both isoforms of the mouse CysLT1 receptor. The primers are identified by arrows in the schematic diagram (Upper) relating the long and short isoforms to the genomic organization. The exons are shown as boxes with the common coding region in black and the N-terminal extended coding region in the long isoform in gray. Restriction sites: B, BamHI; H, HindIII; S, SacI; Bg, BglII. The expected size of the products is noted both in the schematic diagram and at the left of the ethidium bromide-stained gel (Lower).

