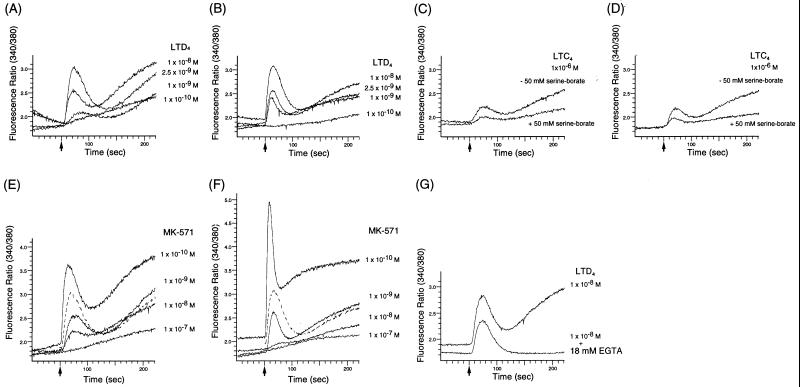
Figure 3.
Calcium mobilization in CHO cells expressing the short (A, C, E, and G) and the long (B, D, and F) isoforms of the mouse CysLT1 receptor. The arrows indicate the point of injection of LTs. (A and B) Dose-dependent responses of the transformants to LTD4. (C and D) Responses to 1 × 10⁻⁶ M LTC4 in the presence or absence of 50 mM serine-borate. (E and F) Responses to 1 × 10⁻⁸ M LTD4 in the presence of various concentration of MK-571; broken lines show the responses in the absence of MK-571 from A and B of this experiment. (G) Response to 1 × 10⁻⁸ M LTD4 in the presence or absence of 18 mM EGTA. Results are representative of at least three independent analyses.

