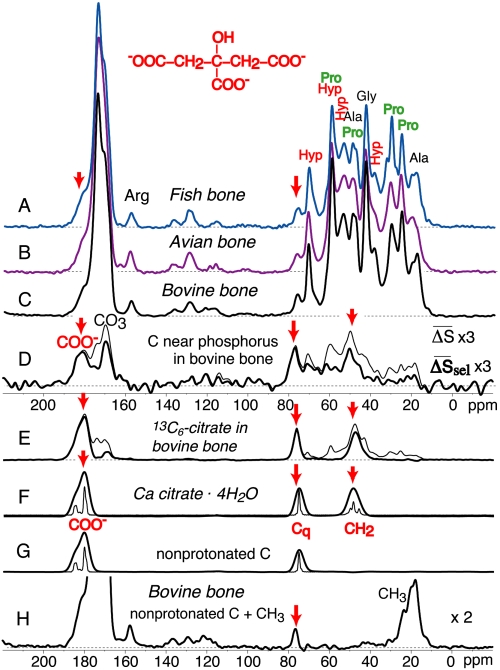
Fig. 1.
13C NMR spectra of bone, of organic residues at the interface with apatite, and of 13C-labeled citrate in bone. (A) Fish bone; (B) avian bone; and (C) bovine bone. (D) Spectra of 13C near 31P in bovine bone. Thin line: 13C{31P} REDOR difference (ΔS) spectrum (total measuring time: 19 d). Thick line: Same data but with the spectrum S scaled up by 1.1 to match the 43-ppm peak of Gly in S0 and thus remove signal of abundant interior collagen residues. (E) Thin line: Spectrum of bovine bone with uniformly 13C-labeled bound citrate, introduced after (partial) removal of native citrate by treatment with hot dilute acid. Thick line: Same data after subtraction of the collagen background, isolating the signals of bound citrate. (F) Spectrum of calcium citrate, with minimal line broadening (thin line) and broadened (thick line) to match that in (D) and (E). (G) Same as (F) after 40 μs dipolar dephasing, which selects signals of carbons with weak C─H dipolar couplings, i.e., nonprotonated C and mobile CHn. (H) Spectrum of bovine bone after 40 μs dipolar dephasing. Citrate signals are highlighted by red arrows.

